- Study overview
- Study design and cohort
- Sequencing and bioinformatics
- Machine learning classifier
- Baseline microbiome differences
- Precision formulation pipeline
- Microbiome outcomes post-intervention
- GI symptom outcomes (GSRS)
- Behavioral and developmental outcomes
- Metabolic pathway analysis
- Correlations
- Safety and tolerability
- Limitations — in full
- Full citation and disclosures
1. Study overview
The study — “Precision synbiotics increase gut microbiome diversity and improve gastrointestinal symptoms in a pilot open-label study for autism spectrum disorder” — was published in mSystems (American Society for Microbiology) on April 25, 2024. It is the largest published investigation of personalized probiotic + prebiotic (synbiotic) intervention designed specifically for autistic individuals.
The core hypothesis: autistic individuals harbor a measurably distinct microbiome signature that can be identified via machine learning, and that personalized synbiotics (custom probiotics + matched prebiotics) formulated from that signature can increase microbial diversity and reduce GI symptoms.
Why this study matters: Most probiotic studies use a single, one-size-fits-all formula. This study formulated a unique blend for each participant — 4 to 8 probiotic strains plus 1 to 2 prebiotics, selected from over 100 scientifically studied ingredients based on each person's individual microbiome data.
2. Study design and cohort
This was a pilot open-label study — participants knew they were receiving the intervention. There was no placebo arm. The neurotypical controls (n=123) provided baseline microbiome samples for the ML classifier but did not receive the intervention.
IRB approval: Arizona State University, STUDY00012299. Registered on ClinicalTrials.gov before enrollment began.
Enrollment criteria
- ASD diagnosis: Confirmed via professional diagnosis (physician, psychologist, or school evaluation)
- Age range: 2.5–75 years
- Exclusions: Antibiotic use in the last 2 months; medication, supplement, or therapy changes in the last 2 months or planned during the first 3 months
- No exclusion for diet type, GI severity, or concurrent non-antibiotic medications — reflecting real-world conditions
Cohort demographics
| Characteristic | ASD group (n=296) | Neurotypical (n=123) |
|---|---|---|
| Mean age | 10.41 yrs (SD 7.14) | 10.74 yrs (SD 8.71) |
| Age range | 2.5–75 years | Age-matched |
| Male | 79.7% | 52.0% |
| Diet quality (below avg or poor) | ~60% | Not collected |
| Average diet | 22.6% | Not collected |
| Excellent or very good diet | 17.5% | Not collected |
| GFCF diet | ~33% | Not collected |
| Vegetarian | 5% | Not collected |
| Taking additional supplements | ~65% | Not collected |
| Geography (USA) | 89% | 96% |
Retention: 170 of 296 (57.4%) completed the full protocol. Dropout reasons among the 126 who left: lack of perceived benefit (34%), price (21%), customer service issues (3 cases). On average, 5–6 months elapsed between the baseline sample and the second timepoint sample receipt and processing.
Note on gender imbalance: The ASD group was 79.7% male vs. 52.0% in controls. The authors note this is a limitation. However, an initial analysis found no significant differences in microbial alpha or beta diversity between sexes in either cohort in this dataset.
3. Sequencing and bioinformatics
This study did not use standard 16S rRNA amplicon sequencing with a public pipeline. Instead, it used a proprietary metagenomic approach:
- Platform: Illumina NextSeq 550, 150 bp × 150 bp paired-end reads
- Mean sequencing depth: 17.15 million total reads (ASD cohort), 6.14 million reads (control cohort)
- Mean classified reads: 71% in both cohorts
- Reference database: Hand-curated database of ~23,000 microbial species, sourced from RefSeq, Greengenes, HMP, NCBI, and PATRIC
- Functional analysis: HUMAnN2 with MetaCyc and UniRef90 databases
- Gene family analysis: UniRef90 (201901b release); threshold >1,000 reads per kilobase per gene family
What this means: The resolution is significantly higher than typical 16S studies. Instead of looking at one gene region, the sequencing captures the full genetic content, enabling species-level (and sometimes strain-level) identification across ~23,000 reference organisms. This is the same technology used to build each participant's personalized formula.
4. Machine learning classifier
The research team built a stochastic gradient boosting classifier to distinguish ASD microbiomes from neurotypical microbiomes using the baseline sequencing data.
Model specification
| Parameter | Value |
|---|---|
| Algorithm | Stochastic gradient boosting |
| Training / test split | 75% / 25% |
| Interaction depth tested | 1, 5, 9 |
| Number of trees tested | 50–1,500 (step 50) |
| Shrinkage | 0.1 |
| Optimal interaction depth | 9 |
| Optimal tree count | 1,350 |
Results
Important caveat: The training-set performance (AUC 0.95, sensitivity 0.90) looks impressive, but the validation accuracy was only 21.8%. The authors describe this as a “low level of predictive accuracy” on held-out data. This means the model can detect patterns in the training data but does not generalize reliably to new samples for predicting ASD status from microbiome data alone. The model's value is in identifying which taxa differ — not as a diagnostic tool.
A separate Random Forest analysis on the baseline cohort comparison had an out-of-bag error rate of 17.54%. From the top 50 features, 28 taxa reached significance after FDR correction and are described in the next section.
5. Baseline microbiome differences
The Random Forest analysis identified 28 taxa significantly different between ASD and neurotypical cohorts after false discovery rate (FDR) correction:
Elevated in ASD
The following genera/species were found at significantly greater proportions in the ASD cohort:
- Achromobacter
- Aeromonas
- Bacillus sp. (not B. subtilis specifically)
- Burkholderia
- Clostridium
- Cronobacter
- Klebsiella
- Micrococcus
- Rhodococcus
- Shigella
- Streptomyces
Reduced in ASD (higher in controls)
These taxa were at significantly larger proportions in the neurotypical cohort:
- Bacillus subtilis
- Faecalibacterium
- Fibrobacter
- Fusicatenibacter
- Lachnospira
- Lactococcus
- Paenibacillus
- Pseudoflavonifractor
- Ruminococcus
- Virgibacillus
Baseline diversity
| Metric | ASD (n=296) | Neurotypical (n=123) | Significance |
|---|---|---|---|
| Shannon index | 3.90 (SD 0.48) | 4.04 (SD 0.38) | Significantly lower in ASD |
| Richness | Lower | Higher | Significantly lower in ASD |
| Evenness | Lower | Higher | Significantly lower in ASD |
Beta diversity (baseline)
- PERMANOVA: p = 0.065, R² = 0.00319 — no significant overall difference in community composition
- PCO1 axis (Wilcoxon): p = 0.0102 — significant separation
- PCO2 axis (Wilcoxon): p = 4.68 × 10⁻¹² — highly significant separation
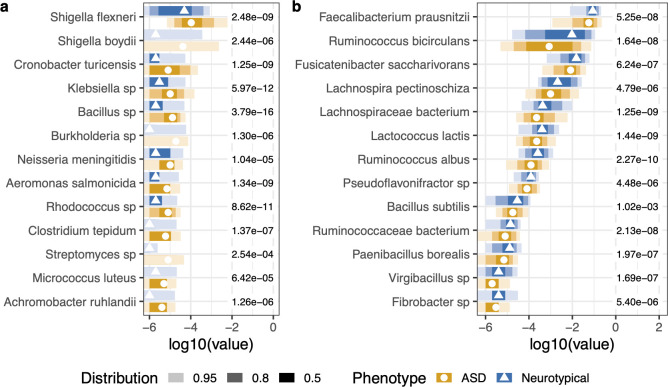
In plain language: Autistic individuals had measurably lower gut diversity at baseline. Their microbiomes were missing key beneficial organisms (Faecalibacterium, Ruminococcus, Fusicatenibacter) and had elevated levels of potentially problematic genera (Clostridium, Klebsiella, Shigella). This is the signature the personalized formulations were designed to address.
6. Precision formulation pipeline
This is where the study departs from every other probiotic trial. Instead of giving everyone the same capsule, the team used a multi-step personalized pipeline:
Step 1: Metagenomic profiling
Each participant submitted a stool sample analyzed via Illumina NextSeq 550 sequencing (150 bp paired-end). Reads were aligned against the ~23,000 species reference database to produce a detailed species-level profile.
Step 2: Gap analysis
Each individual's profile was compared against the neurotypical reference panel and an internal database of healthy microbiome distributions, informed by the ML classifier's feature importance rankings. This identified which beneficial taxa were depleted and which potentially harmful taxa were elevated for that specific person.
Step 3: Custom synbiotic blend
- Probiotic component: 4–8 strains per participant, selected from >100 scientifically studied ingredients. Species and strains chosen based on the clinical literature curation database for their “ability to modulate the microbiota–gut–brain axis and improve ASD-specific characteristics”
- Prebiotic component: 1–2 types per participant, chosen to selectively feed target organisms
- Each formula was different — no two participants received the same blend
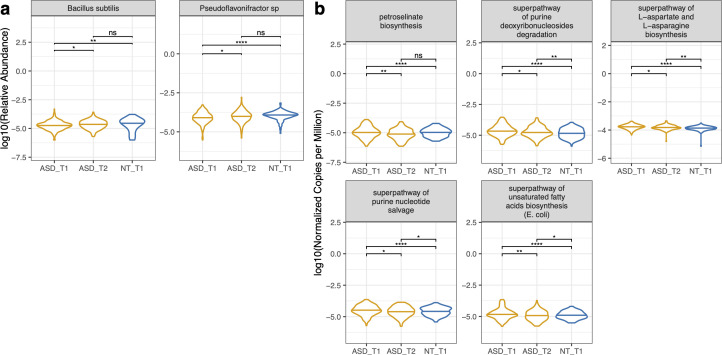
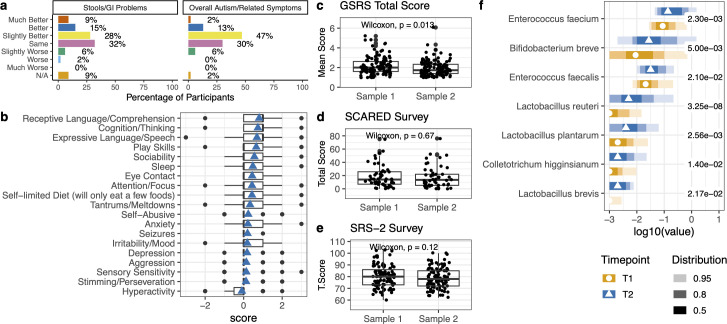
Post-intervention taxa that increased
After 3 months, participants showed significant increases in:
- Bacillus subtilis — increased to the point of being no longer significantly different from neurotypical controls
- Pseudoflavonifractor sp. An85 — same, converged with controls
- Bifidobacterium breve
- Lactobacillus reuteri
- Lactobacillus plantarum
- Lactobacillus brevis
- Enterococcus faecium (not a probiotic ingredient — endogenous increase)
- Enterococcus faecalis (not a probiotic ingredient — endogenous increase)
Manufacturing: All formulations produced under cGMP conditions by Flore Inc. at their facility in Joliet, IL. Each batch quality-tested for strain identity, viability (CFU count), and contaminant absence before shipping.
7. Microbiome outcomes post-intervention
The primary microbiome endpoints were changes in alpha diversity from baseline (T1) to 3-month post-supplementation (T2) among the 170 completers.
| Metric | What it measures | Change T1 → T2 | Significance |
|---|---|---|---|
| Shannon index | Richness + evenness combined | Significant increase | p < 0.05 |
| Observed richness | Total number of unique taxa | Significant increase | p < 0.05 |
| Pielou's evenness | How evenly taxa are distributed | Significant increase | p < 0.05 |
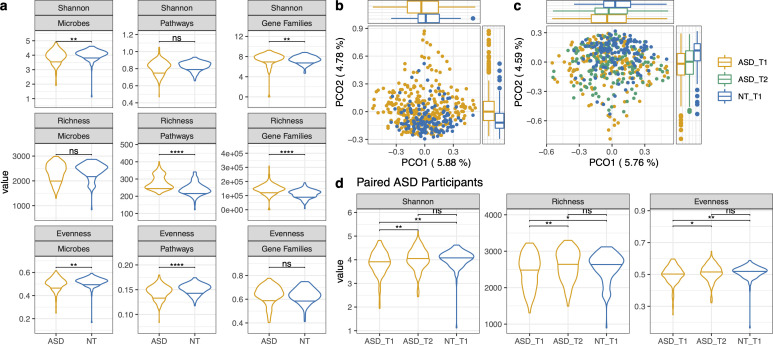
Key result: After supplementation, the ASD cohort's alpha diversity metrics were no longer significantly different from the neurotypical controls. The gut ecosystems became richer, more balanced, and more diverse — converging toward the healthy control profile.
Beta diversity (post-intervention)
| Comparison | PCO1 (p.adj) | PCO2 (p.adj) |
|---|---|---|
| ASD T1 vs. NT T1 | 0.006 | 2.43 × 10⁻⁹ |
| ASD T2 vs. NT T1 | 0.0165 | 2.62 × 10⁻⁸ |
| ASD T1 vs. ASD T2 | No significant difference | |
The overall community composition (beta diversity) showed a shift toward the neurotypical cluster on PCO axes, though the ASD T1 vs. T2 comparison did not reach significance — meaning the shift was directional but modest at the whole-community level.
8. GI symptom outcomes (GSRS)
GI symptoms were measured using the Gastrointestinal Symptom Rating Scale (GSRS), a validated clinical instrument with five subscales scored 1–7 (1 = no discomfort, 7 = very severe).
Baseline GSRS scores
| Subscale | Baseline mean (SD) | Interpretation |
|---|---|---|
| Overall composite | 2.25 (0.97) | Slight to mild discomfort |
| Abdominal pain | 3.37 (1.26) | Mild to moderate discomfort |
| Constipation | 2.69 (1.61) | Slight to mild |
| Indigestion | 2.39 (1.80) | Slight to mild |
| Diarrhea | 2.01 (1.22) | Slight |
| Reflux | 1.69 (1.16) | No to slight discomfort |
Post-supplementation
The composite GSRS score significantly decreased from T1 to T2 (Wilcoxon test, p < 0.05), indicating a reduction in GI symptom severity. Per the PGIA GI-specific question, 52% of participants reported GI improvement.
This is meaningful because GI symptoms affect up to 90% of autistic individuals and are correlated with behavioral challenges, sleep disruption, and reduced quality of life.
9. Behavioral and developmental measures: no significant change
This is where honesty matters most. The pilot's supported outcomes are about the gut — a significant increase in microbiome diversity and a significant reduction in GI symptom severity. The study did not establish any effect on autism itself, and standardized behavioral instruments detected no significant change. Autism is neurodivergence, not a disease, and this product does not treat, cure, or change autism.
PGIA (a subjective, parent-reported global measure)
The PGIA asks parents to rate change from baseline on a scale of −3 (much worse) to +3 (much better). The overall average score at follow-up was 0.36 ± 0.55 — and, as the authors themselves flag, that sits squarely within the placebo range: a 2013 placebo-controlled study by Adams et al. reported a placebo-group PGIA of 0.34 ± 0.54, nearly identical. Because this was an uncontrolled, open-label pilot with a subjective, self-selected reporter, any parent-reported change cannot be distinguished from a placebo effect. We do not present it as evidence that the synbiotic improves autism, language, or cognition — it does not.
SRS-2 (Social Responsiveness Scale, 2nd edition)
Baseline mean: 80.08 (SD 10.36). Distribution: 29% moderate, 6% severe, 6% mild-to-moderate.
Result: No significant change post-supplementation.
SCARED (Screen for Child Anxiety Related Disorders)
| Subscale | Baseline mean (SD) | % Meeting threshold |
|---|---|---|
| Overall | 19.34 (15.46) | 26.1% may have anxiety disorder |
| Separation anxiety | 4.42 (3.74) | 42.0% |
| Social anxiety | 5.49 (4.12) | 29.3% |
| School avoidance | 1.52 (1.87) | 27.4% |
| Generalized anxiety | 4.04 (4.44) | 19.1% |
| Panic disorder | 19.34 (15.46) | 17.8% |
Result: No significant change post-supplementation.
Summary of behavioral measures: The subjective, parent-reported global measure (PGIA) fell within the placebo range and cannot be distinguished from a placebo effect. The SRS-2 and SCARED (standardized instruments) showed no significant changes. The honest interpretation: the supported evidence from this study is in gut-microbiome diversity and GI symptoms — not behavioral or autism outcomes.
10. Metabolic pathway analysis
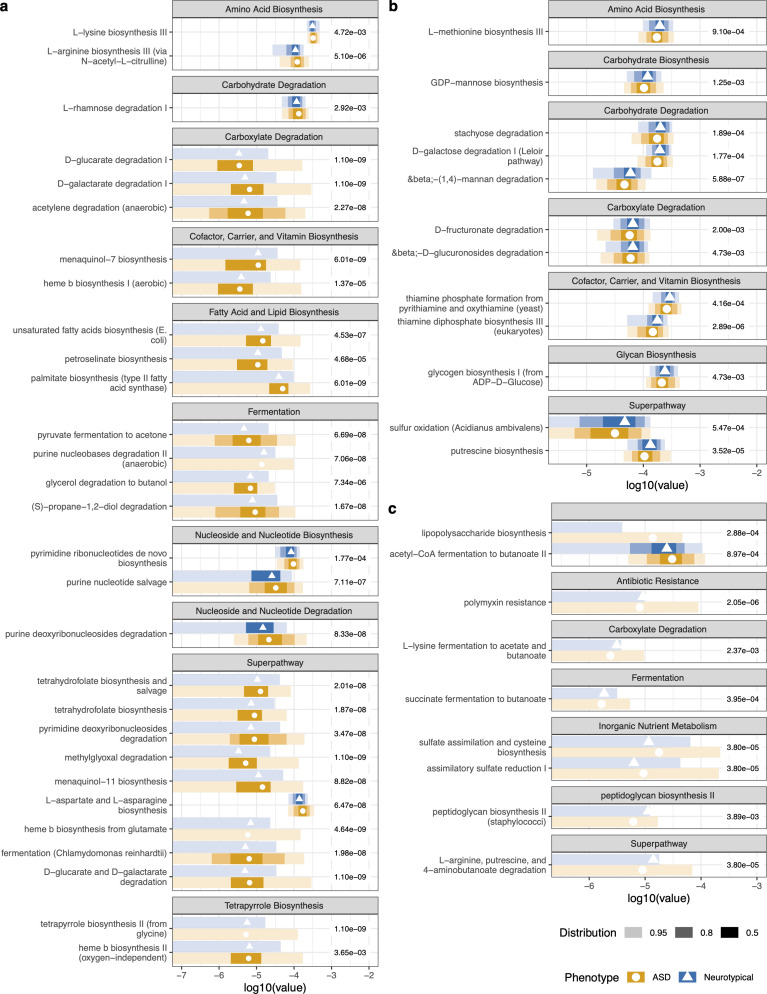
Using HUMAnN2 functional profiling, the study identified significant differences in metabolic pathways between ASD and neurotypical microbiomes at baseline:
Elevated in ASD microbiomes
- Biosynthesis of amino acids, cofactors, vitamins, fatty acids/lipids, nucleotides, tetrapyrrole
- Degradation of carboxylates
- Fermentation of pyruvate, alcohols, and fermentation to short-chain fatty acids
- LPS (lipopolysaccharide) biosynthesis superpathway — associated with gut inflammation
- Polymyxin resistance — antibiotic resistance pathway
Reduced in ASD microbiomes
- Carbohydrate degradation
- Sulfur oxidation
- Thiamine biosynthesis
- Peptidoglycan biosynthesis (higher in controls)
- 4-aminobutanoate (GABA) degradation — significantly lower in ASD vs. controls
Post-supplementation pathway changes
Several pathways significantly decreased after intervention, converging toward neurotypical levels:
- Petroselinate biosynthesis — decreased, no longer significantly different from NT
- L-aspartate and L-asparagine biosynthesis — decreased
- Unsaturated fatty acid biosynthesis — decreased
- Purine deoxyribonucleoside degradation — decreased
- Purine nucleotide salvage — decreased
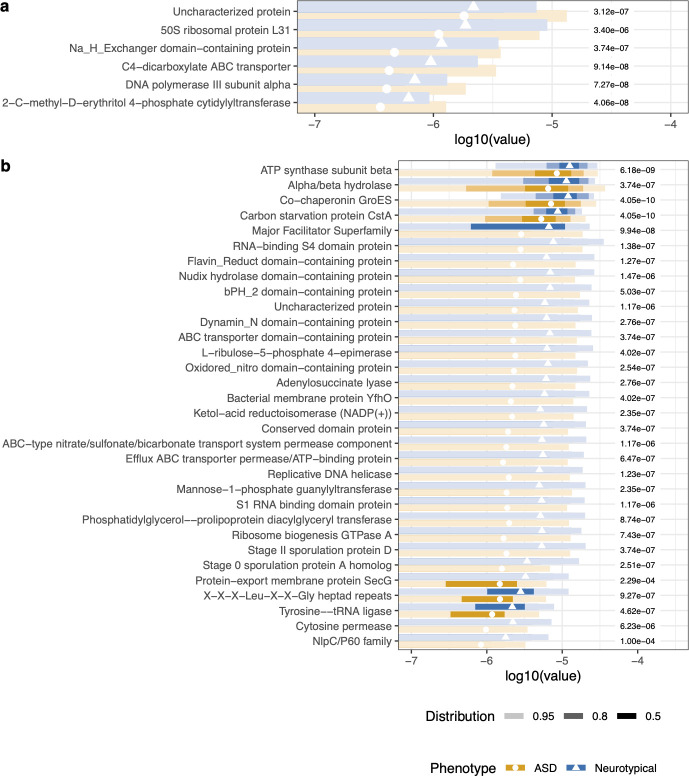
Gene family analysis
A Random Forest on gene families had an error rate of 15.35%. Of the top 50 discriminating gene families: 6 were higher in ASD, 44 were lower. Most of the depleted gene families were annotated from Ruminococcus spp., Fusicatenibacter saccharivorans, and Faecalibacterium prausnitzii — key butyrate producers and gut-health organisms.
11. Correlations
The study tested several correlations between microbiome metrics, behavior, and nutrition:
| Correlation | Pearson r | p-value | Direction |
|---|---|---|---|
| Nutritional assessment ↔ PGIA | −0.19 | 0.025 | Worse nutrition → worse ASD severity |
| Fruit servings ↔ Richness | 0.20 | 0.031 | More fruit → higher microbiome richness |
| Microbial evenness ↔ SCARED total | −0.17 | 0.045 | Lower evenness → higher anxiety |
Non-significant: Shannon, richness, and evenness were not significantly correlated with overall nutritional assessment, PGIA at baseline, SRS-2, or GSRS.
Subgroup analyses
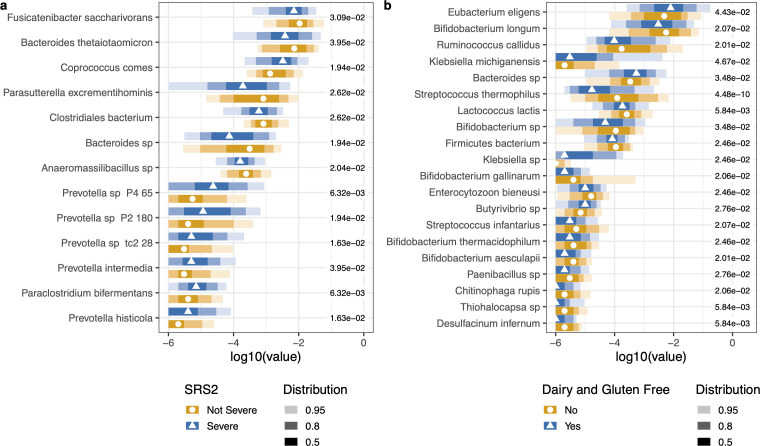
- SRS-2 severity: Random Forest identified significant microbial differences between severe vs. non-severe social responsiveness groups. Prevotella spp., Bacteroides, and Fusicatenibacter were higher in the severe group.
- Diet (GFCF vs. inclusive): Dairy/gluten consumers had higher Bifidobacterium spp., Lactococcus lactis, and Streptococcus spp. No significant beta diversity differences by diet.
- Gender: No significant differences in microbial alpha or beta diversity between sexes in either cohort.
- Anxiety (SCARED): No significant microbial species differentiated cohorts based on anxiety status.
12. Safety and tolerability
- No serious adverse events (SAEs) attributed to the intervention
- Only 6% reported any worsening on the PGIA overall scale
- Dropout was logistical, not safety-related: 34% cited lack of perceived benefit, 21% cited price, 3 cases related to customer service
- Exclusion criteria (no antibiotics in prior 2 months, no medication changes) helped ensure a clean baseline
13. Limitations — in full
The authors themselves list these limitations. We believe in showing the full picture:
- Open-label, no placebo arm. Participants knew they were receiving the intervention. Placebo effect and expectation bias cannot be ruled out — especially for subjective measures like PGIA.
- PGIA scores are within placebo range. The overall PGIA change (0.36 ± 0.55) is nearly identical to the placebo group in Adams et al. 2013 (0.34 ± 0.54). The authors explicitly state: “Survey to measure improvements is comparable to a placebo effect.”
- SRS-2 and SCARED showed no significant change. The standardized behavioral instruments detected no significant change; only the subjective, parent-reported global measure moved at all, and that movement was within placebo range.
- Gender imbalance. ASD cohort was 79.7% male vs. 52.0% in controls. While no diversity differences by sex were found in this dataset, evidence from other studies suggests gender may influence the ASD microbiome.
- No control data on diet, GI, or behavior. The neurotypical controls provided microbiome samples only. No dietary, GI, or behavioral data was collected from controls, limiting comparison.
- 42.6% dropout rate. Only 170 of 296 completed the full protocol. Completers may systematically differ from dropouts — particularly since 34% dropped out for “lack of perceived benefit,” which biases the remaining sample toward those who felt it was working.
- Each participant got a different formula. This is inherent to the personalized approach but makes it impossible to attribute outcomes to any specific strain or combination.
- ML classifier doesn't generalize. The stochastic gradient boosting model achieved AUC 0.95 on training data but only 21.8% accuracy on validation — it overfits and cannot be used as a diagnostic tool.
- No long-term follow-up. Whether benefits persist after stopping supplementation is unknown.
- Not a randomized controlled trial (RCT). The gold standard for causal claims. The authors describe this as a pilot study. A proper RCT would be needed to establish efficacy.
Our position: This is meaningful pilot data, and its supported findings are about the gut — the microbiome diversity gains and the reduction in GI symptom severity. The behavioral measures cannot be separated from placebo effect given the study design, so we make no behavioral or autism-symptom claims. Autism is neurodivergence, not a disease; we don't claim to treat, cure, or change it. What we do offer is a personalized, clinician-reviewed probiotic focused on gut health — and the science warrants continued investigation, ideally through a randomized controlled trial.
14. Full citation and disclosures
Phan J, Calvo DC, Nair D, Jain S, Montagne T, Dietsche S, Blanchard K, Treadwell S, Adams J, Krajmalnik-Brown R. “Precision synbiotics increase gut microbiome diversity and improve gastrointestinal symptoms in a pilot open-label study for autism spectrum disorder.” mSystems. 2024;9(5):e00503-24.
DOI: 10.1128/msystems.00503-24
PubMed Central: PMC11097633
License: Open access (CC BY 4.0)
Conflicts of interest
Transparency matters. Here are the declared conflicts:
- J. Phan, D. Nair, S. Jain, T. Montagne, S. Dietsche, K. Blanchard, and S. Treadwell are employed by Flore Inc. (which acquired Sun Genomics Inc.)
- D.C. Calvo was co-supported by Flore Inc. (which acquired Sun Genomics Inc.)
- J. Adams and R. Krajmalnik-Brown are co-founders of Gut-Brain Axis Therapeutics Inc., which is developing microbiome-based treatments for autism and other disorders
The study was conducted through IRB collaboration between Sun Genomics, Arizona State University, and the Biodesign Center.